Reference-based Multiple Imputation (1) - RTB and Washout Methods
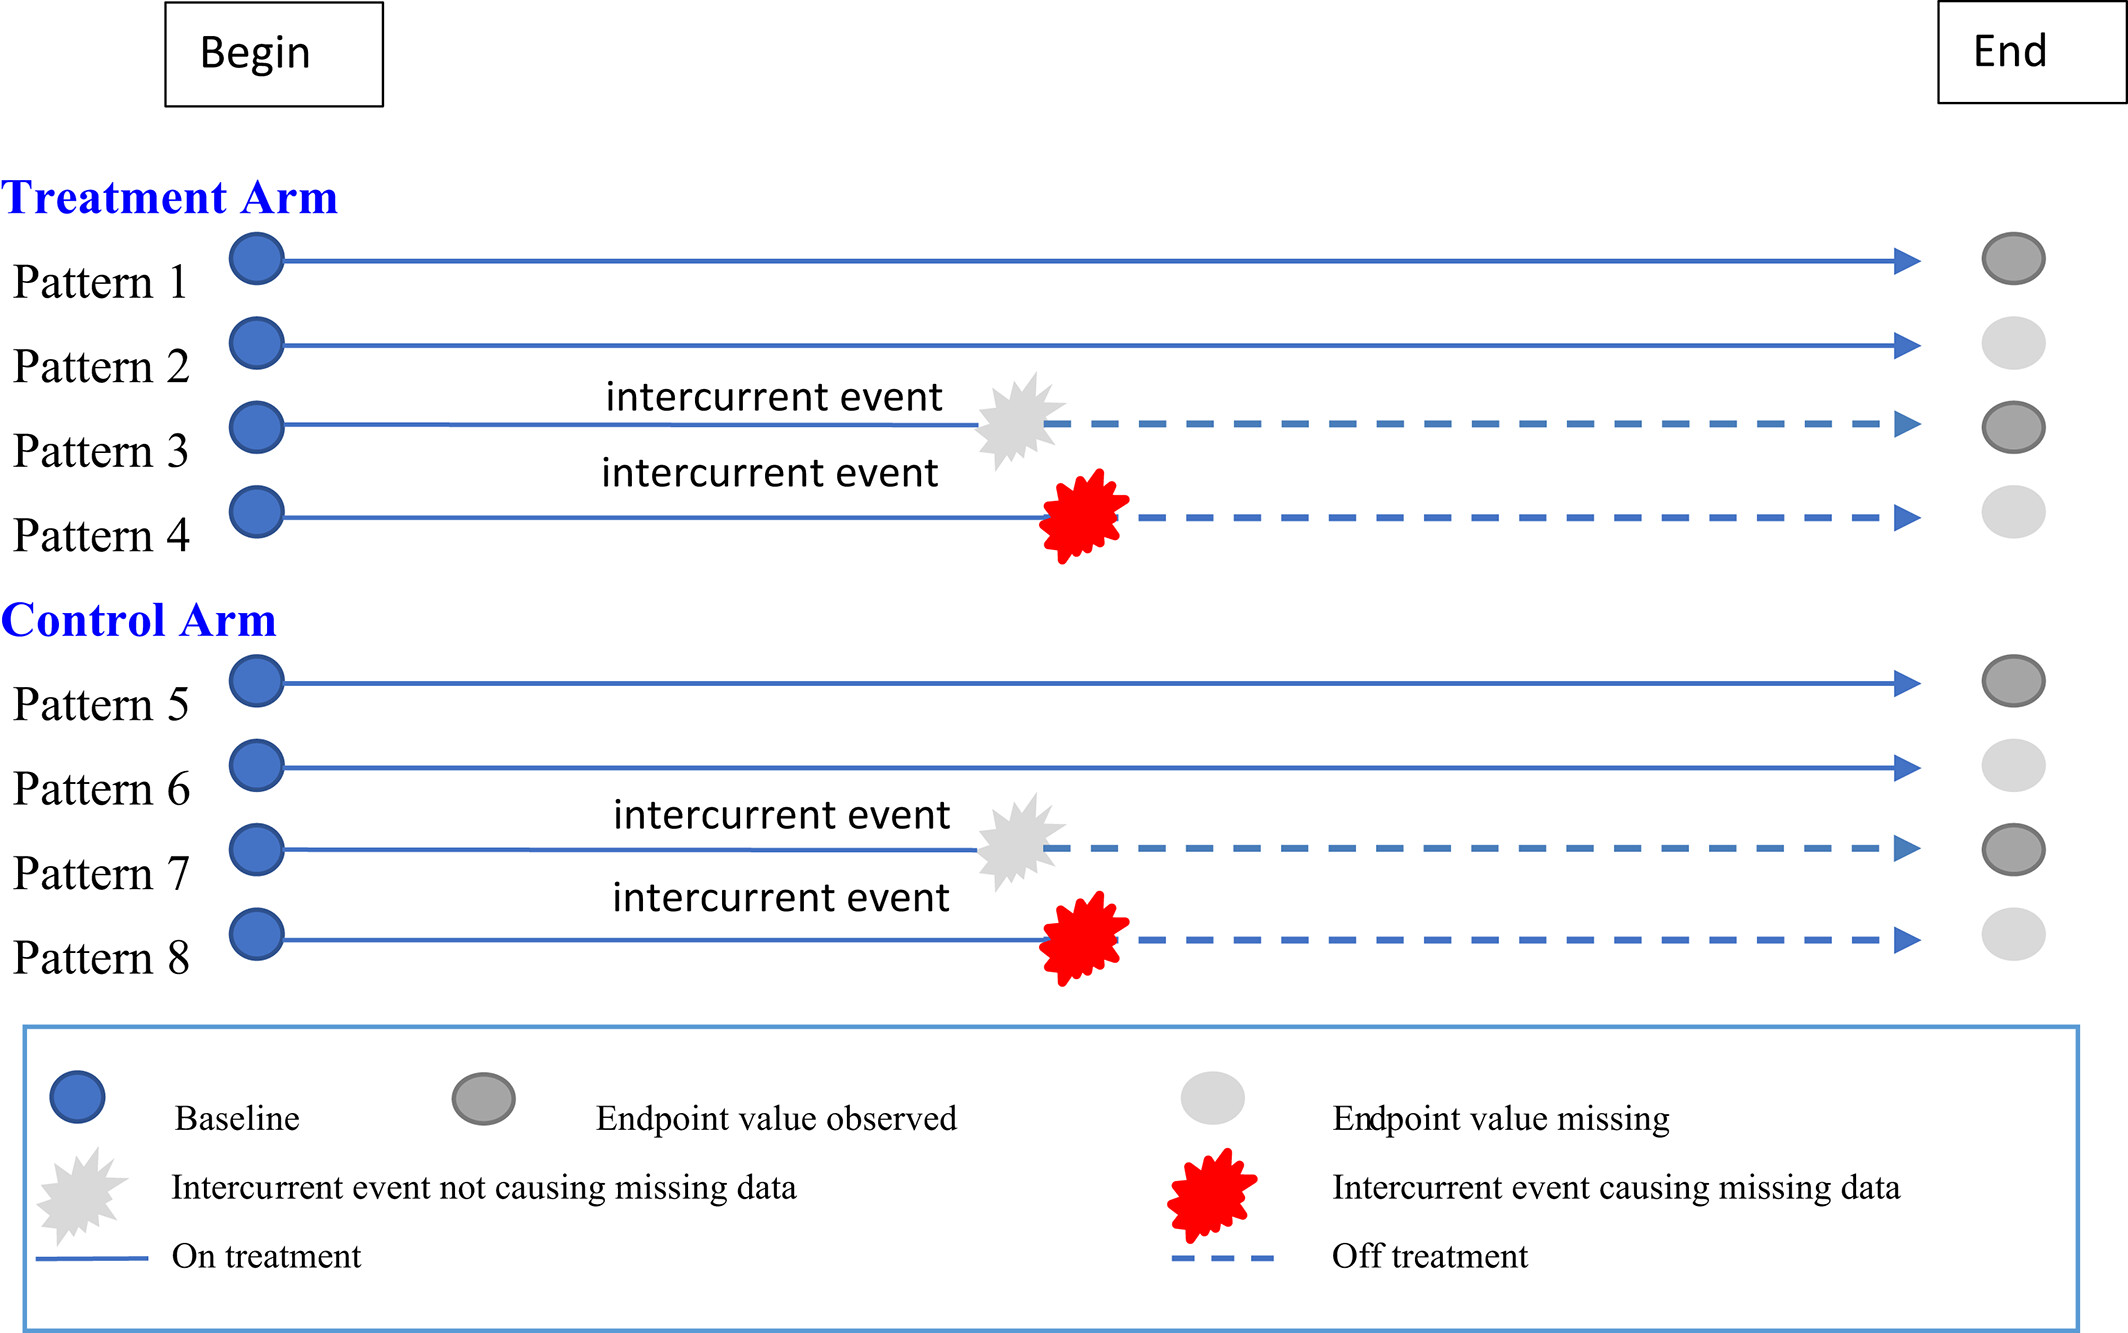
Missing data pattern
Basic notations
Let \(Y = [y_1, y_2, y_3, \dots, y_{J-1}, y_J]\) be an \(n\) by \(J\) matrix, where each column vector \(y_j = [y_{j,1}, y_{j,2}, \dots, y_{j,i}, \dots, y_{j,n-1}, y_{j,n}]^T\) records a continuous endpoint of interest (e.g., HbA1c in a diabetes trial) measured from \(n\) subjects at a pre-specified timepoint \(j\), for \(j = 1, \dots, J-1, J\). Specifically, \(y_1\) and \(y_J\) are the measurements taken at baseline and the primary timepoint of interest (e.g., HbA1c at Week 26), respectively.
In practice, \(y_1\) can be completely observed, but missing records in \(y_J\) are unavoidable.
Consider \(y_J = (y_J^{(obs)}, y_J^{(mis)})\), a partition of \(y_J\) into two parts consisting of the observed data \(y_J^{(obs)}\) and the missing data \(y_J^{(mis)}\).
Use \(X\) to denote covariates.
Return to baseline (RTB) method
In active-controlled trials, an RTB method can be used to impute missing data from Patterns 4 and 8 when an RD analysis (read my another post about RDO) is not feasible.
The RTB approach assumes that there is no placebo effect, and any drug effect will be washed out after treatment discontinuation that is, the effect of any continued background therapy or alternative therapy is only expected to prevent further deterioration from baseline.
Note: RTB方法假设不存在安慰剂效应,并且在中止治疗后,任何药物的疗效都会消退(被洗脱);也就是说,任何继续使用的背景治疗或替代疗法的效果,仅仅被预期为能够防止病情较基线(初始)水平进一步恶化。可以把它拆解成具体的假设:
1. 停药后药物失效:如果一个患者中途退出了试验并停止服药,RTB方法假设试验药物带来的所有好转都会完全消失(洗脱)。
2. 没有安慰剂效应作用:它假设患者不会仅仅因为“参与了试验”或“吃过药”就保持病情好转(即排除安慰剂效应)。
3. 其他药物只能“保底”: 患者退组后,可能会继续服用他们原本的常规药物(背景治疗),或者换用其他的救急药物(替代治疗)。我们假设这些其他药物无法让患者的病情比试验开始时(基线水平)更好,它们最大的作用就是兜底——确保患者的病情不会比一开始更糟糕。
在RTB时,大概意思就是:如果患者中途退出了,我们就悲观且保守地认为,患者的身体各项指标会“打回原形”,完全恢复到参加试验第一天(基线)的状态。 既不会更好,也不会更坏。
Using \(y_1^{\text{(obs)}}\) to denote the corresponding observed baseline data for each subject, the conditional predictive distribution used in imputing missing data in those subjects is
\[ P \left( y_J^{\text{(mis)}} \Big| \theta^*, y_1^{\text{(obs)}}, X \right). \]
The imputation model can be simplified based on the Bayesian imputation principles by only using the subject’s baseline value \(y_1^{\text{(obs)}}\) plus some random variation to impute missing \(y_J^{\text{(mis)}}\):
\[ y_J^{\text{(mis)}} \sim y_1^{\text{(obs)}}. \]
This RTB method is NOT the same as a baseline observation carried forward (BOCF) approach.
For RTB, both the estimated mean (i.e., the baseline value) and the estimated variance of the missing final assessments are considered using MI. For residual variance estimation, at least two approaches can be considered, including:
- Using a model such as the ANCOVA with the same covariates and response variable as specified for the primary endpoint analysis.
- Using an ANCOVA model similar to the first approach, but the baseline value is treated as the response variable instead of a covariate.
One advantage of the first approach is that the estimated residual variance is based on the time of the final assessment after considering the impact of covariates. A drawback is that only observed final assessments can be used in the model. Because there might be differences between subjects who have final assessments and those who do not, the residual variance by the first approach can be underestimated.
The advantage of the second approach is that there are usually very few or no missing values for baseline measurements. It is possible to use information from both approaches to improve the residual variance estimate. For example, to double-check whether variability is underestimated, one could compare residual variance estimates over the same group of subjects at the baseline and at the final assessment.
The baseline value \(y_1^{\text{(obs)}}\) plus some random variation approach is commonly used for the RTB imputation in many new drug applications.
However, Qu and Dai (2022) demonstrated that this traditional RTB imputation method may result in biased mean and/or inflation in the variance for imputed “complete” data when the probability of missingness depends on the observed baseline or post-baseline intermediate outcomes.
To mitigate this problem, a new RTB imputation method has been developed by Qu and Dai (2022) and Leurent et al. (2020) independently.
Wang et al. (2023) used this new RTB method in their simulations to impute missing data via the following three steps:
Impute the missing values \(y_J^{\text{(mis)}}\) for each treatment group separately under the ignorable missingness assumptions. Let \(y_{J,k,i}^{\text{(Imp)}}\) denote the imputed value for subject \(i\) in treatment group \(k\).
For each treatment group \(k\), let \(\bar{y}_{J,k}\) be the sample mean of the imputed complete data.
Return-to-baseline imputation \(y_{J,k,i}^{*\text{(Imp)}}\) for subject \(i\) in treatment group \(k\) is given by:
\[y_{J,k,i}^{*\text{(Imp)}} = y_{J,k,i}^{\text{(Imp)}} - \bar{y}_{J,k} + \bar{y}_1,\]
where \(\bar{y}_1\) is the overall mean of the observed baseline value \(y_1^{\text{(obs)}}\) across treatment groups.
When compared to the washout method, the RTB method may be a viable and simpler option in a placebo-controlled study when the placebo group’s change from baseline (based on previous studies) is expected to be close to zero.
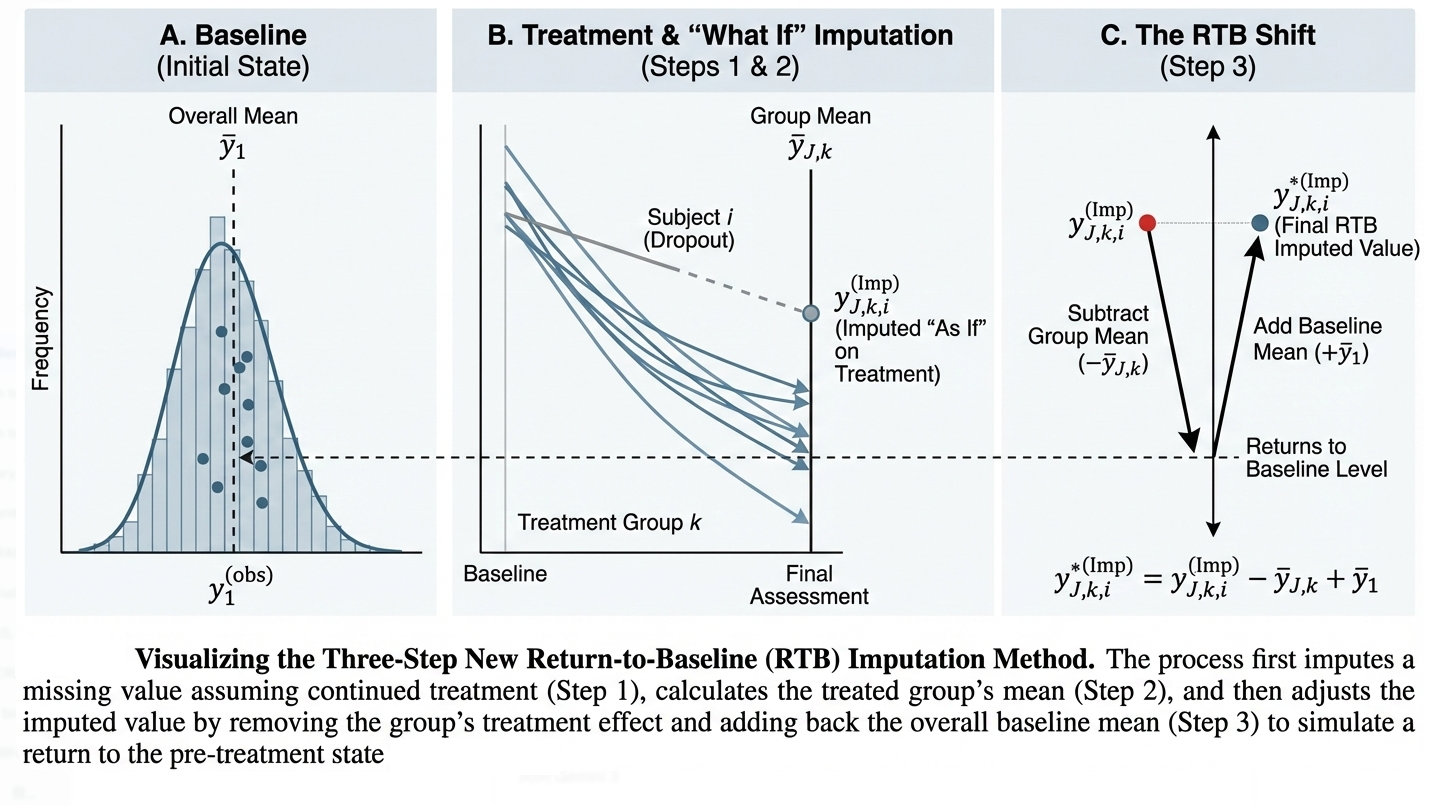
Note: Step 1 is the imputation under MAR using ignorable missingness assumptions. It predicts what the patient’s outcome would have been based on their previous data and the data of others in their group who stayed.After step 1, we will get a “complete” dataset where even dropouts have a predicted score based on the drug’s effect.
In Step 2, we calculate the average group response. This average represents the “total effect” of being in that treatment group (including the drug effect).
In Step 3, we will do the “baseline shift” to simulate the RTB. The formula \(... - \bar{y}_{J,k} + \bar{y}_1\) “subtracts” the treatment effect and “adds back” the baseline. I.E., this part \(y_{J,k,i}^{\text{(Imp)}} - \bar{y}_{J,k}\) effectively “removes” the benefit the patient gained from the drug. By shifting the data this way, the final imputed value for a dropout reflects the group’s starting state rather than the drug’s success, which satisfies the RTB assumption more accurately than older methods.
Washout method
The washout method is a statistical approach used in placebo-controlled clinical trials to handle missing data when a “Retrieved Dropout” (RD) analysis is not feasible. (Note: using treatment policy strategy to handle ICE + RDO; this method serves as a backup method similar to other reference-based method)
It is primarily applied to subjects who were randomized to the experimental treatment but discontinued the study early.
Core Mechanism: “Erasing” the Drug Effect
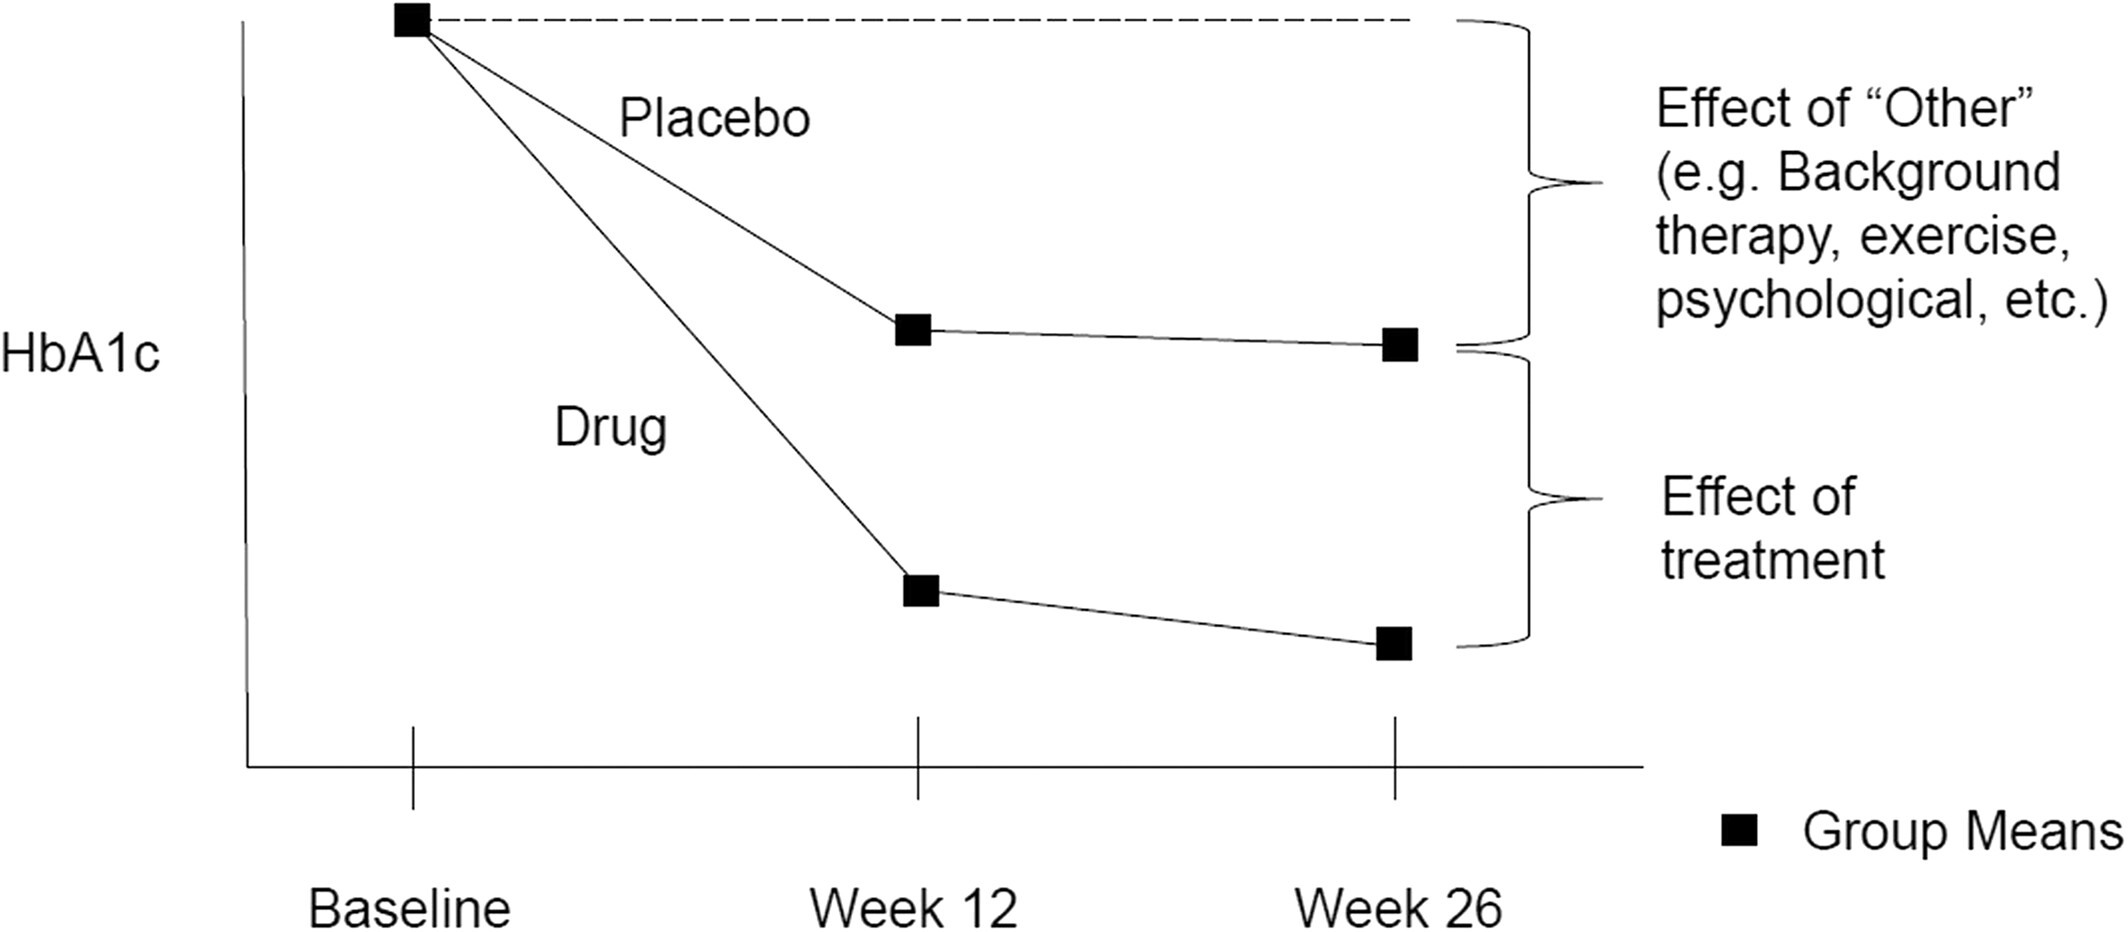
The method differentiates between the placebo effect (improvements from background therapy, diet, and exercise) and the experimental treatment effect (additional benefits from the actual drug):
- Treatment Arm Assumption: In the experimental group, the total observed effect is a combination of both the placebo effect and the drug’s specific efficacy.
- The “Washout” Action: If a subject in the experimental arm drops out, the method “washes out” or erases only the portion of the improvement attributed to the experimental drug.
- Retention of Placebo Effect: Even after the drug effect is removed, the subject is assumed to still benefit from the same “placebo effect” (such as background care) observed in the placebo arm.
Note: 结合上图进一步解释。图展示了一项安慰剂对照的抗高血糖临床试验中随时间变化的平均HbA1c水平。该图区分了安慰剂效应,以及纯粹来自试验性治疗的效应。
具体而言,随着研究进展,由于背景疗法、饮食和运动等因素,安慰剂组受试者的HbA1c可能出现下降。
另一方面,假设试验性治疗有效,试验组受试者会表现出更显著的效应(例如HbA1c降幅更大)——这一效应同时包含了安慰剂效应与试验性治疗的效应。
“安慰剂洗脱”(Placebo washout)仅指在退出研究的试验组受试者中,试验药物产生的效应被消除(理解上就是,比如dropout后,药物产生的treatment effect被消除了,即上图的effect of treatment)。对这些受试者而言,安慰剂效应是唯一保留的效应。
For subjects who drop out, the washout method assumes they lose the specific advantage of the experimental medication but continue to experience the general improvements seen in the control group.
To model a washout of the drug effect among dropouts from the experimental arm, the authors directly impute missing endpoint measurements at the primary timepoint (e.g., 26-week), without imputing intermediate values.
The imputation model is built based on placebo completers only. The dependent variable is the endpoint measurement. Independent variables include baseline measurements and other prespecified baseline covariates.
Let \(Y_{\text{PBO}}^{\text{(obs)}}\) be the observed data from completers in the placebo arm (Patterns 5 and 7). The conditional predictive distribution to impute missing data is:
\[P \left( y_J^{\text{(mis)}} \Big| \theta^*, Y_{\text{PBO}}^{\text{(obs)}}, X \right)\]
To impute missing data from the experimental arm, only completers from the placebo arm and subjects with \(y_J\) missing in the experimental arm will be included in the following imputation model:
\[y_J \sim y_1^{\text{(obs)}} + X \quad \text{(for the experimental arm, Washout)}\]
To impute missing data from the placebo arm, an MAR assumption can be accepted and therefore include intermediate measurements in the imputation. All subjects in the placebo arm will be included in the following imputation model:
\[y_J \sim y_1^{\text{(obs)}} + Y_{\text{int}}^{\text{(obs)}} + X \quad \text{(for the placebo arm)}\]
STATISTICAL REVIEW AND EVALUATION for Welchol® (Colesevelam Hydrochloride) by FDA Statistical Reviewers
Note: The following part is an illustrative implementation based on FDA statistical review for Welchol®. Two issues regarding the applicant’s efficacy analysis were identified during this review. One of the issues was with respect to missing data imputation. Instead of MI based on the washout method as recommended by the division, the applicant imputed missing endpoint data with a single imputation method based on LOCF. An IR was sent to the applicant on January 15, 2021, requesting the applicant to redo their primary analysis based on FDA recommended washout method. The applicant rejected this request however, arguing that the statistical analysis was conducted according to the analysis plan, which was created 10 years ago and approved by the Agency at the time. After several rounds of communication, the Agency and the applicant reached an agreement that the FDA statistical reviewer would redo the primary efficacy analysis for the applicant using the recommended ITT set and the washout method for missing data imputation.
Estimand
The reviewer performed the primary efficacy analysis based on the treatment policy estimand, as was recommended by the FDA for anti-diabetic products. The treatment policy estimand for this study was characterized as follows:
Targeted Study Population: Pediatric patients (10 to 17 years old) with T2DM.
Endpoint: Change from baseline in A1c at Month 6.
ICEs strategy: Use 6-month A1c regardless of whether study medication or rescue medication was taken up to Month 6.
Population-Level Summary: Difference in endpoint means comparing the effect of the drug vs placebo.
Issues
The applicant failed to follow the treatment policy estimand when handling intercurrent events. Specifically, the applicant discarded all data collected after the initiation of rescue medications and imputed missing endpoints vis a single imputation based on LOCF.
It is worth noting that the study was underpowered for the given sample size. As specified in the study protocol, the study intended to achieve an 80% power for detection of a 0.4% treatment difference in HbA1c. This implied a width of 0.56% for a 95% confidence interval. In reality, however, the width for the observed confidence interval was 0.85% (based on the reviewer’s result). This suggested that, during the study planning stage, the applicant understated the residual SD, and likely the amount of missing data. In order to accomplish an 80% power, the study should have recruited approximately 2.3 times as many subjects as its current sample size \(((0.85\% / 0.56\%)2≈ 2.3)\).
The primary analyses conducted by this reviewer
The endpoint of A1C change from baseline at Month 6 was analyzed using analysis of covariance (ANCOVA). The ANCOVA model adjusted for terms for treatment, previous T2DM treatment stratum, and baseline A1c.
The washout approach was utilized for multiple imputation of the missing endpoint data.
Missing endpoints from both treatment arms were imputed based on the observed endpoints from the placebo arm.
When imputing missing endpoints in the treatment arm, a regression model with previous T2DM treatment stratum and baseline A1c was utilized, whereas the regression model for imputation of the placebo arm also included intermediate endpoint values (i.e., Month-3 A1c) as an additional covariate.
This imputation procedure was repeated 100 times. For each completed dataset, the change from baseline at Month 6 was analyzed using an ANCOVA model with the same set of covariates specified for the primary analysis.
Finally, Rubin’s rule was adopted to combine the results for statistical inference.
STATISTICAL REVIEW AND EVALUATION for alogliptin (Nesina) and alogliptin and metformin hydrochloride (Kazano) tablets by FDA Statistical Reviewers
Another review: alogliptin (Nesina) and alogliptin and metformin hydrochloride (Kazano) tablets®
Issues
The study had large missing data (18.7% with alogliptin, 17.1% with placebo) and few retrieved dropouts for primary endpoint assessments. Two statistical review issues were found:
Estimand: The applicant did not specify the definition of Estimands in the protocol, statistical analysis plan (SAP), or clinical study report (CSR). Further, the applicant excluded subjects who received hyperglycemic rescue before Week 26 from the primary analysis implying hypothetical strategy for these intercurrent events.
Analysis method to deal with missing data: The applicant used mixed model for repeated measure (MMRM) as the primary analysis to deal with large missing data. MMRM approach may be inappropriate due to overestimation of the treatment effect under the assumption of missing at random. And there were insufficient number of retrieved dropouts in the study.
To address above issues in this review, the efficacy of alogliptin was evaluated with preferred estimand using treatment policy strategy for intercurrent events. This reviewer used all randomized and treated subjects without excluding subjects who received hyperglycemic rescue before Week 26 in the primary analysis.
Due to insufficient number of retrieved dropouts, this reviewer handled missing data using placebo washout multiple imputation to reflect the missing not at random, which is more plausible assumption in this study.
In the IR letter issued on November 16, 2022, FDA requested the applicant to perform primary endpoint analysis using the placebo washout imputation that includes subjects who received hyperglycemic rescue before Week 26 and increases the number of imputed datasets to 100.
FDA reviewer validated the applicant’s program codes and found that the data manipulation and imputation steps were technically different from Agency’s recommendation. (Note: 申请人使用的washout method和FDA的不同,最后FDA采用了Reviewer的方法)
The primary analyses conducted by the sponsor
The applicant imputed multiple times for missing week 26 HbA1c measurement using a modified placebo-based pattern mixture model (PMM).
- Step 1: For each patient with missing Week 26 data, 100 measurements will be imputed, thus generating 100 complete datasets as follows:
- Subjects on alogliptin 25 mg with missing week 26 HbA1c measurement: A multiple imputation regression is used with sex, schedule (A/B) at screening, baseline and Week 26 data from placebo completers. None of the subjects’ intermediate measurements will be used.
- Subjects on placebo with missing non-monotone week 26 HbA1c measurements: A single chain MCMC method is used with sex, schedule (A/B) at screening, baseline, intermediate, and Week 26 measurements from placebo completers. The subjects’ intermediate measurements will be used.
- Subjects on placebo with missing monotone Week 26 HbA1c measurements: A multiple imputation regression is used with sex, schedule (A/B) at screening, baseline, intermediate, and Week 26 measurements from placebo completers. The subjects’ intermediate measurements will be used.
- Step 2: Each complete dataset after imputation will be analyzed using ANCOVA with treatment, schedule (A/B), and baseline HbA1c as covariates. Rubin’s rule will be applied for inference.
The primary analyses conducted by the FDA statistical reviewer
Step 1: Generate the monotone data including 100 measurements for each patient using sex, schedule (A/B) at screening, baseline and intermediate, and Week 26 measurements.
Step 2: For each patient with missing Week 26 data, 100 measurements will be imputed, thus generating 100 complete datasets as follows:
Subjects on alogliptin 25 mg with missing Week 26 HbA1c measurement: A multiple imputation regression is used with sex, schedule (A/B) at screening, baseline and Week 26 data from placebo completers. None of the subjects’ intermediate measurements will be used. (Note: it is my understanding that the regression used is trained only on placebo completers and excludes intermediate data.)
Subjects on placebo with missing Week 26 HbA1c measurements: A multiple imputation regression is used with sex, schedule (A/B) at screening, baseline, intermediate, and Week 26 measurements from placebo completers. The subjects’ intermediate measurements will be used. (Note: it is my understanding that the regression used here is also trained on placebo completers but includes intermediate data. We would structure the data so that the intermediate value is its own column like
lm(Week26 ~ Baseline + Week12 + Sex + Schedule, data = placebo_completers). The rationale of using intermediate data is that a patient’s own trajectory is usually the strongest predictor of their final outcome.)
Step 3: Each dataset will be analyzed using ANCOVA with treatment, schedule (A/B), and baseline HbA1c as covariates. Rubin’s rule will be applied for inference.
In this review, subsequent analyses were performed using FDA statistical reviewer’s placebo washout imputation method. To check the robustness of primary endpoint analysis using placebo washout approach, missing primary endpoint was multiply imputed based on the return-to-baseline (RTB) approach.
Recommendation for using washout method as per Wang et al. 2023
While extensive research exists on Jump to Reference (J2R) and Copy Reference (CR) methods, FDA statistical reviewers generally favor the Washout method for primary efficacy analyses in placebo-controlled antihyperglycemic trials.
Why the Washout method is preferred over the alternatives:
Washout Method (Preferred) – Computational Efficiency: It produces results similar to J2R but is computationally less intensive.
Conservativeness: It is generally more conservative than J2R. By completely “washing out” the effect of the experimental treatment, it avoids retaining partial treatment effects observed at intermediate timepoints (e.g., Week 12) before an intercurrent event.
Jump to Reference (J2R) – The Drawback: J2R imputes missing data conditional on intermediate measurements. Consequently, it does not fully remove the influence of the experimental treatment received prior to dropout, making it less conservative than the Washout method in certain scenarios. (Note: J2R保留了部分治疗效应,相比washout method不够保守)
Copy Reference (CR) – Unrealistic Assumption: CR assumes subjects in the experimental arm had the same mean response as the placebo group even before dropping out, which typically contradicts actual observations. Additionally, the analysis result based on the CR approach is not always conservative, which may increase the risk of an inflated type I error rate (Note: 这一点很反直觉).
Reference
Leurent B, Gomes M, Cro S, Wiles N, Carpenter JR. Reference-based multiple imputation for missing data sensitivity analyses in trial-based cost-effectiveness analysis. Health Econ. 2020 Feb;29(2):171-184. doi: 10.1002/hec.3963. Epub 2019 Dec 17. PMID: 31845455; PMCID: PMC7004051.
Qu Y, Dai B. Return-to-baseline multiple imputation for missing values in clinical trials. Pharm Stat. 2022 May;21(3):641-653. doi: 10.1002/pst.2191. Epub 2022 Jan 5. PMID: 34985825.
Wang, Y., Tu, W., Kim, Y., Sinks, S., He, J., Cambon, A., & Clark, J. (2023). Statistical methods for handling missing data to align with treatment policy strategy. Pharmaceutical Statistics, 22, 650.
https://www.fda.gov/media/175697/download?attachment
https://www.fda.gov/media/155316/download